Who’s afraid of the big bad geneticist?
Unfinished article
Understanding public perception of genomics is crucial for ethically establishing systems of translational medicine. Despite efforts towards effective altruism, the use and strategies of genomic intervention ought remain in the control of the public; the greatest tasking lies in adequate technical education for a topics with a high barrier to entry. Human genomics may be one field where oversimplified summaries are not sufficient to demonstrate the grand value for human health, agriculture, and other unexpected benefits. I shall continue to add high-quality resources that may be useful to this post, over time.
Public perception
In studying the “Global Public Perceptions of Genomic Data Sharing: What Shapes the Willingness to Donate DNA and Health Data?”, (Middleton et al., 2020) perform analysis of peoples’ familiarity with the concepts of DNA and genomics, and associations in the willingness to donate DNA and medical information. Publishor url: https://www.cell.com/ajhg/fulltext/S0002-9297(20)30292-5 and link to pdf.
The analysis have been adjusted for sociodemographic factors, etc. Not all demographies were homogeneously familiar with genetics, but the meta-analysis showed associations between understanding and participation willingness.
-
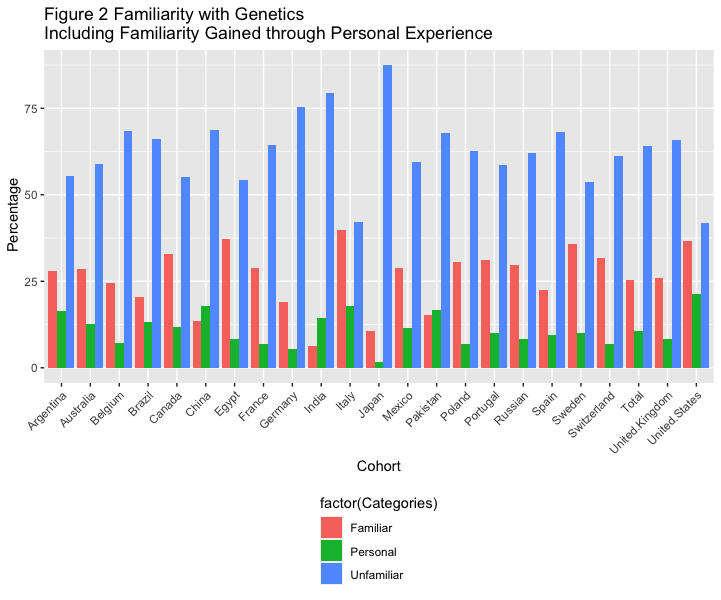
There was evidence for between-country heterogeneity (\(I^2\) = 48% and \(I^2\) = 61% for familiarity with genetics and personal experience, respectively).
-
Compared to participants who were unfamiliar with genetics, those who were familiar or had personal experience had greater odds of being willing to donate (odds ratio [OR] = 1.85, 95% CI = 1.11-2.00; OR = 2.70, 95% CI = 2.37- 3.09, respectively).
-
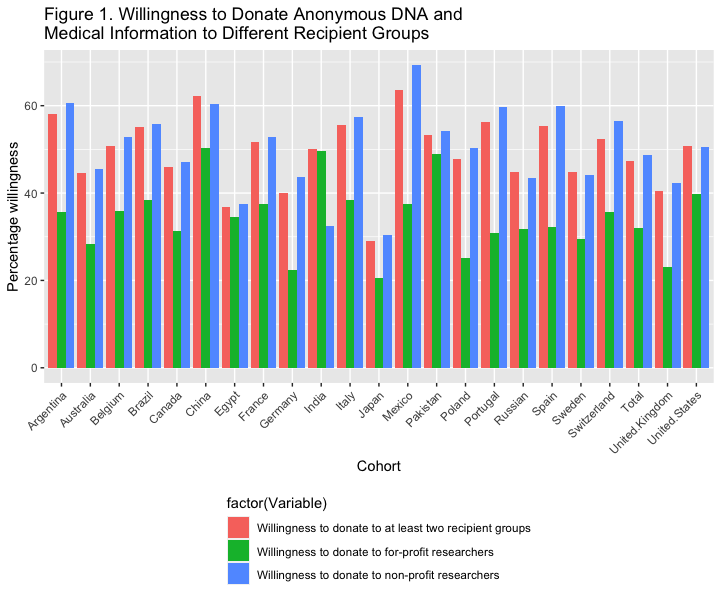
Similar results were seen when considering single groups of recipients of donated DNA and medical information, i.e. doctors, non-profit researchers, for-profit researchers.
-
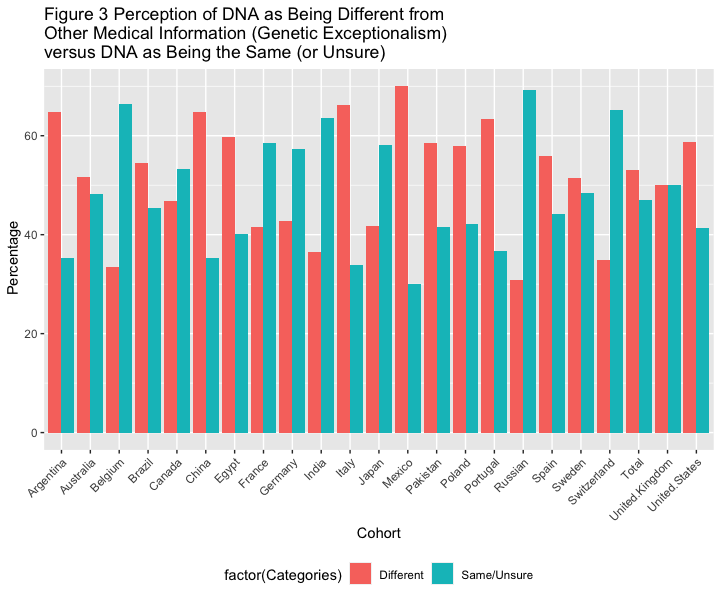
The association between genetic exceptionalism (perception DNA is different from other medical data) and willingness to donate was OR 1.60 (95% CI = 1.47–1.75).
-
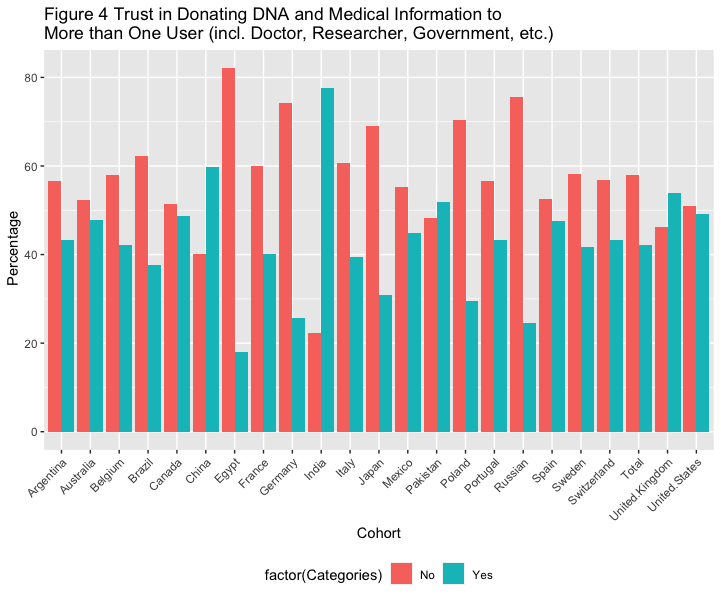
There was a strong association between trust in multiple actors (doctors, non-profit researchers, commercial researchers, governments, etc.) and willingness to donate DNA and medical information. The pooled OR was 3.85 (95% CI = 3.34–4.44).
To re-illustrate the authors’ work I have downloaded the data and reproduces the characteristics plots here as follows. This data was used for the meta-analysis to report the ORs listed above. The R code that I used for this process is included.
# Data source: DOI:https://doi.org/10.1016/j.ajhg.2020.08.023
# Download Supplemental data (mmc3.xlsx) Table S2. Unadjusted Results for Full Dataset, Stratified by Country
# Convert data to tsv format.

data <-
  read.table(file="mmc3.tsv",
             header = TRUE,
             sep = "\t")

require(tidyr)
data_l <- gather(data, cohort, value,
       Total:United.States, na.rm = FALSE, convert = FALSE, factor_key = FALSE)

data_l_sep <- separate(data_l, value,
                       sep = "\\(|\\)",
                            into = c("value", "samples"))

# Get variable names for filtering
unique(data_l_sep$Variable)
Then plotting the main figures as follows
require(ggplot2)
# Figure 1. Willingness to Donate Anonymous DNA and Medical Information to Different Recipient Groups, Stratified by Country
df1 <- data_l_sep %>%
  filter(Variable == "Willingness to donate to at least two recipient groups" |
           Variable == "Willingness to donate to non-profit researchers" |
           Variable == "Willingness to donate to for-profit researchers") %>%
  filter(Categories == "Yes") %>%
  group_by(Variable)

df1 %>%
ggplot(aes(x=factor(cohort), y=as.numeric(value), fill=factor(Variable))) +
  geom_bar(stat="identity", position="dodge")+
  theme(axis.text.x = element_text( angle = 45, hjust = 1 ),
        legend.position="bottom", legend.direction="vertical") +
  labs(x = "Cohort", y = " Percentage willingness ",
       title ="Figure 1. Willingness to Donate Anonymous DNA and\nMedical Information to Different Recipient Groups")
# Figure 2 Familiarity with Genetics (Including Familiarity Gained through Personal Experience), Stratified by Country
df2 <- data_l_sep %>%
  filter(Variable == "Familiarity with genetics") %>%
  filter(Categories == "Personal" | Categories == "Familiar" | Categories == "Unfamiliar") %>%
  group_by(Variable)

df2 %>%
  ggplot(aes(x=factor(cohort), y=as.numeric(value), fill=factor(Categories))) +
  geom_bar(stat="identity", position="dodge")+
  theme(axis.text.x = element_text( angle = 45, hjust = 1 ),
        legend.position="bottom", legend.direction="vertical") +
  labs(x = "Cohort", y = " Percentage",
       title ="Figure 2 Familiarity with Genetics \nIncluding Familiarity Gained through Personal Experience")
# Figure 3 Perception of DNA as Being Different from Other Medical Information (Genetic Exceptionalism) versus DNA as Being the Same (or Unsure), Stratified by Country
df3 <- data_l_sep %>%
  filter(Variable == "Perception of DNA being different to other medical information versus DNA being the same") %>%
  filter(Categories == "Same/Unsure" | Categories == "Different") %>%
  group_by(Variable)

df3 %>%
  ggplot(aes(x=factor(cohort), y=as.numeric(value), fill=factor(Categories))) +
  geom_bar(stat="identity", position="dodge")+
  theme(axis.text.x = element_text( angle = 45, hjust = 1 ),
        legend.position="bottom", legend.direction="horizontal") +
  labs(x = "Cohort", y = " Percentage",
       title ="Figure 3 Perception of DNA as Being Different from\nOther Medical Information (Genetic Exceptionalism)\nversus DNA as Being the Same (or Unsure)")
# Figure 4 Trust in Donating DNA and Medical Information to More than One User (Including Doctor, Researcher, Company, Government, etc.), Stratified by Country
df4 <- data_l_sep %>%
  filter(Variable == "Trust in donating DNA and medical information to more than one user") %>%
  group_by(Variable)

df4 %>%
  ggplot(aes(x=factor(cohort), y=as.numeric(value), fill=factor(Categories))) +
  geom_bar(stat="identity", position="dodge")+
  theme(axis.text.x = element_text( angle = 45, hjust = 1 ),
        legend.position="bottom", legend.direction="horizontal") +
  labs(x = "Cohort", y = " Percentage",
       title ="Figure 4 Trust in Donating DNA and Medical Information to \nMore than One User (incl. Doctor, Researcher, Government, etc.)")
References
- Middleton, A., Milne, R., Almarri, M. A., Anwer, S., Atutornu, J., Baranova, E. E., Bevan, P., Cerezo, M., Cong, Y., Critchley, C., & others. (2020). Global public perceptions of genomic data sharing: what shapes the willingness to donate DNA and health data? The American Journal of Human Genetics, 107(4), 743–752.
Maintained by Dylan Lawless. Scientist at EPFL. Resume and Google scholar. RSS feed