Bayesian statistics introduction
- Bayes’ Theorem Formula
- Bayesian and Frequentist Methods: Two Statistical Philosophies
- Bayesian Methods: An Overview and Examples
- Prior Distributions in Bayesian Methods
- Likelihood and Posterior Distributions in Bayesian Methods
- Summarizing and Presenting Bayesian Results
- Using Bayesian Analyses in Medicine
- Using Bayesian Analyses
- Bayesian Checklist
- Comparison of Bayesian and Frequentist Methods
- References
This material is reproduced based on the examples from: Oxford handbook of medical statistics (Janet Peacock Philip J Peacock) [1].
Bayes’ Theorem Formula
- Describes the Bayesian approach to statistical analysis in contrast to the frequentist approach
- Covers prior and posterior distributions, their roles, and choices
- Discusses examples, pros and cons of Bayesian methods in medicine, and how to interpret them in medical literature
- Developed by Reverend Thomas Bayes in 1763
- Statement about conditional probabilities, used in many statistical areas
- Events A and B:
- \(Pr(A \mid B)\): ‘the probability of A happening given that B has already happened’
- \(Pr(A \mid B)\) = \(\frac{Pr(B \mid A) \times Pr(A)}{Pr(B)}\)
Bayesian and Frequentist Methods: Two Statistical Philosophies
- Bayes’ theorem forms the basis for competing statistical philosophies: Bayesian and frequentist methods
- They differ in their definitions of probability
Bayesian Approach
- Probability interpreted as degree of belief that an event will occur
- Degree of belief comes from past data or experience
- Unknown quantities (e.g., means, proportions) follow probability distributions expressing certainty about true value
- Degree of belief can be updated with further information
Frequentist Approach
- Probability is the long-run frequency of events (r) that occur in n trials
- Probabilities estimated directly from samples
- Unknown quantities (e.g., means, proportions) considered fixed, estimated from data with confidence intervals
Bayesian Methods: An Overview and Examples
How Bayesian Methods Work
- Combines anticipated values or distribution of values (prior) with new data
- Updates the distribution of the true values
Example 1: Estimating Prevalence
- Specify anticipated value or distribution for prevalence (prior) using national data
- Collect regional data and calculate prevalence
- Combine observed area prevalence with prior distribution to update the distribution of true prevalence in the region
Example 2: Using Bayes’ Theorem to Update Estimates
- Study investigated new D-dimer test for diagnosing venous thromboembolism (VTE) in patients with suspicious symptoms [3]
- Calculate updated probability that a patient has VTE given a positive D-dimer test result: \(\Pr(VTE+ \mid D+)\)
Using Bayes’ theorem:
- \(Pr(VTE^{+})\) = anticipated prevalence of VTE = 14% (0.14)
- \(Pr(D^{+})\) = proportion who test positive on D-dimer = 32% (0.32)
- \(Pr(D^{+} \mid VTE^{+})\) = probability of positive D-dimer test if the patient truly has VTE = 79% (0.79, sensitivity)
- Updated probability that a patient testing positive on D-dimer has VTE is approximately 35%
- Bayesian approach updates estimates, arguably providing better estimates
Bayesian Terminology
- Prior beliefs: Prior distribution
- New data: Likelihood
- Updated estimate: Posterior distribution
Prior Distributions in Bayesian Methods
Introduction to Prior Distributions
- Prior distribution: distribution of unknown quantity combined with new data to provide updated estimate
- Three categories of prior distribution [4]:
- Frequency distribution based on past data
- Objective representation of reasonable beliefs about a quantity
- Subjective measure of an individual’s beliefs
Common ‘Default’ Prior Distributions
- Non-informative/reference priors: e.g., uniform distribution; used when range of values can be pre-specified but no clear opinion about which value is most likely
- Informative-sceptical prior: used to express scepticism about the estimated quantity, reduces chances of spuriously large effects
- Informative-enthusiastic prior: counterbalance of sceptical prior; used when positive effect is expected
- Informative prior based on prior beliefs, which are formally elicited: shape of distribution varies by context, Normal distribution sometimes used
Sensitivity Analyses
- Choice of prior distribution can affect final estimate
- Good practice to test sensitivity of assumptions by using different forms
- If choice doesn’t affect updated estimate, results are more robust
- If choice matters, present range of results to demonstrate sensitivity to the prior
Key Points on Prior Distributions [5]
- Choice is based on judgement, subjectivity is unavoidable
- Use a range of options to test sensitivity of choice
- Clearly justify choice(s) of prior to make results credible to external consumers
Likelihood and Posterior Distributions in Bayesian Methods
Likelihood
- Summary of evidence from new data
- Combined with prior distribution to create updated posterior distribution
Posterior Distribution
- Updated probability distribution for unknown quantity
- Reflects range of possible values and degree of belief associated with each value
- Less uncertainty than prior distribution; tends to be narrower than prior distribution and likelihood
Example: Combining Prior Distribution and Data
- Prior distribution: evidence available before study
- Likelihood: evidence from study itself
- Posterior distribution: pools two sources of evidence by multiplying curves together [6]
- Prior distribution pulls likelihood towards null value (0), making final result less extreme
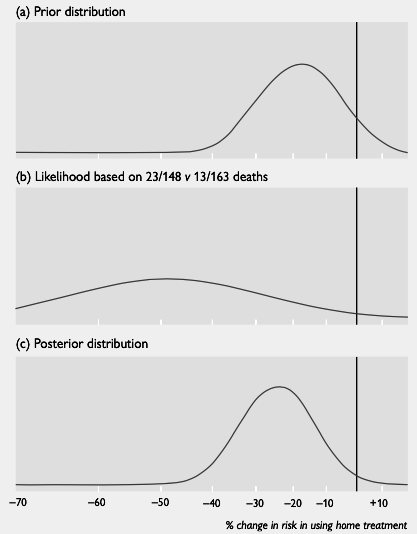
Figure 1. Illustration of how Bayesian analysis combines a prior distribution (top graph) with the data (‘likelihood’, middle graph) to give the posterior distribution (bottom graph). Reproduced from BMJ, Spiegelhalter et al, 319, 508 1999.
Conjugate Distributions
- Common for prior and posterior distributions to be related (same distribution or family of distributions)
- Makes calculations more feasible
Summarizing and Presenting Bayesian Results
Estimates
- Summary measure (mean, median) often presented
- Other estimates (standard deviation, interquartile range) depend on distribution shape and context
Posterior Probabilities
- Posterior distribution is a probability distribution
- Can calculate probabilities for a specific range of values for estimated quantity
- Example: Probability that relative risk in a trial is greater than 1 (showing efficacy)
Credible Intervals (Posterior Interval)
- Commonly present 95% credible intervals for posterior estimates
- Represents range within which true value lies with 95% probability
- Different from 95% confidence intervals (based on sampling distribution, not probability distribution)
- Easy to calculate for unimodal and symmetrical posterior probability distributions; more complex otherwise
95% Credible Interval vs. 95% Confidence Interval
- 95% probability that true value lies within 95% credible interval
- 95% probability that a 95% confidence interval contains true value
- Differences between the two are subtle and may not be practically significant for data interpretation
Significance Tests
- No formal place in Bayesian framework
- Emphasis on distribution of estimates, not testing against a single value
- Posterior probability distribution can be used to calculate probability that true value takes specific values
- Bayesian approach provides information needed, rather than yes/no approach of significance testing
- Both Bayesian and frequentist statisticians agree that single value or test against single value is of limited usefulness
Using Bayesian Analyses in Medicine
Bayesian methods are used in various medical research areas:
- Observational studies
- Design, monitoring, and analysis of trials
- Meta-analyses
- Missing data imputation
- Decision making
- Health economics
Applicable in situations similar to frequentist methods (single quantity estimation, regression analysis, multifactorial regression, multilevel models)
Example: GREAT – A Bayesian Re-analysis
- Original GREAT trial examined effect of thrombolytic therapy on patients with suspected myocardial infarction
- Frequentist analysis reported significant beneficial effect on mortality
- Results challenged due to unexpected size, small trial, and more modest effect in unpublished bigger European trial
- Pocock and Spiegelhalter conducted Bayesian re-analysis, constructing prior distribution to express plausible reduction in mortality
- Bayesian analysis showed a reduction in mortality of 25% compared to 49% in frequentist analysis, suggesting over-optimistic trial results
- Demonstrates how Bayesian analysis can be used to combine prior evidence and new data for more reasonable estimates in cases of unexpected results
Using Bayesian Analyses
Paroxetine and Suicide Attempts: A Bayesian Analysis
- Meta-analysis examined the potential link between antidepressant drugs and increased suicides in adults [10]
- Included unpublished data, corrected for duration of medication and placebo treatment
- 7 suicide attempts in patients taking the drug, 1 in patient taking placebo
- Prior distribution assumed to be gamma
- Three different prior distributions tested: pessimistic, slightly pessimistic, and slightly optimistic (Fig. 2)
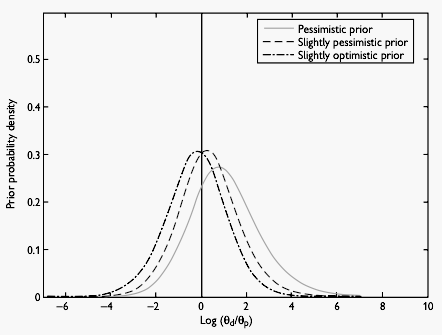
Figure 2. Three different prior distributions used in a meta-analysis of antidepressant drugs and suicide in adults. From Aursnes et al. [10]
Posterior Distributions
- Posterior distributions correspond to the three prior distributions
- Majority of each distribution is greater than 0, indicating evidence in favor of an adverse effect of paroxetine on suicide risk
- Authors reported relative risks of 2.46 (pessimistic prior), 2.20 (slightly pessimistic prior), and 2.34 (optimistic prior)
- Bayesian approach supports recent meta-analyses results, suggesting increased risk of suicidal activity in adults taking certain antidepressant drugs
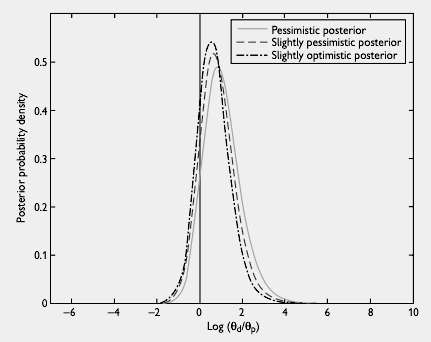
Figure 3. Three posterior distributions corresponding to the three priors used in a meta-analysis of antidepressant drugs and suicide in adults. From Aursnes et al. [10]
Bayesian Checklist
Sung et. al have generated a checklist of seven items (ROBUST) that should be included when a Bayesian analysis is reported[11]. These are helpful in interpreting a Bayesian analysis.
ROBUST (Reporting Of Bayes Used in Clinical STudies)
The box below lists the items included in ROBUST. The checklist can be scored to provide a measure of the quality of reporting, but here it is given as a guide to what points to check when reading an article where Bayesian methods have been used.
- Prior distribution: specified
- Prior distribution: justified
- Prior distribution: sensitivity analysis
- Analysis: statistical model
- Analysis: analytical technique
- Results: central tendency
- Results: standard deviation or credible interval
Comparison of Bayesian and Frequentist Methods
This table is adapted from Spiegelhalter et al. and gives a helpful summary of the two approaches.
| Issue | Frequentist methods | Bayesian methods |
|---|---|---|
| Prior information other than that in the study being analysed | Interpretation of the parameter of interest: Informally used when choosing a model/form of analysis, A fixed unknown value | Used formally by specifying a prior probability distribution, An unknown quantity which can have a probability distribution |
| Basic statistical question | How likely are the data, given a particular value of the parameter? | How likely is the particular value of the parameter given the data? |
| Presentation of results | P values, estimates, confidence intervals | Plots of posterior distribution of the parameter, calculation of specific posterior probabilities of interest, and use of the posterior distribution in formal decision analysis. Expected value and credible intervals |
| Dealing with subsets in trials | Adjusted P values (e.g. Bonferroni) | Subset effects shrunk towards zero by a ‘sceptical’ prior |
Adapted from Spiegelhalter et al. 1999.
References
- Oxford handbook of medical statistics (Janet Peacock Philip J Peacock).
- Bayes T. An essay towards solving a problem in the doctrine of chances. Philos Trans Roy Soc 1763; 53:370–418.
- Kovacs MJ, Mackinnon KM, Anderson D, O’Rourke K, Keeney M, Kearon C et al. A comparison of three rapid D-dimer methods for the diagnosis of venous thromboembolism. Br J Haematol 2001; 115(1):140–4.
- Ashby D. Bayesian statistics in medicine: a 25 year review. Stat Med 2006; 25(21):3589–631.
- Spiegelhalter DJ, Abrams KR, Myles JP. Bayesian approaches to clinical trials and health-care evaluation. Chichester, West Sussex: Wiley, 2004.
- Spiegelhalter DJ, Myles JP, Jones DR, Abrams KR. Methods in health service research: An introduction to Bayesian methods in health technology assessment. BMJ 1999; 319(7208):508–12.
- Gelman A, Carlin John B, Stern Hal S, Rubin DB. Bayesian data analysis. 2nd ed. Boca Raton, FL: Chapman & Hall/CRC, 2004.
- GREAT group. Feasibility, safety, and efficacy of domiciliary thrombolysis by general practition- ers: Grampian Region Early Anistreplase Trial. GREAT Group. BMJ 1992; 305(6853):548–53.
- Pocock SJ, Spiegelhalter DJ. Domiciliary thrombolysis by general practitioners. BMJ 1992; 305(6860):1015.
- Aursnes I, Tvete IF, Gaasemyr J, Natvig B. Suicide attempts in clinical trials with paroxetine randomised against placebo. BMC Med 2005; 3:14.
- Sung L, Hayden J, Greenberg ML, Koren G, Feldman BM, Tomlinson GA. Seven items were identified for inclusion when reporting a Bayesian analysis of a clinical study. J Clin Epidemiol 2005; 58(3):261–8.
Maintained by Dylan Lawless. Scientist at EPFL. Resume and Google scholar. RSS feed